
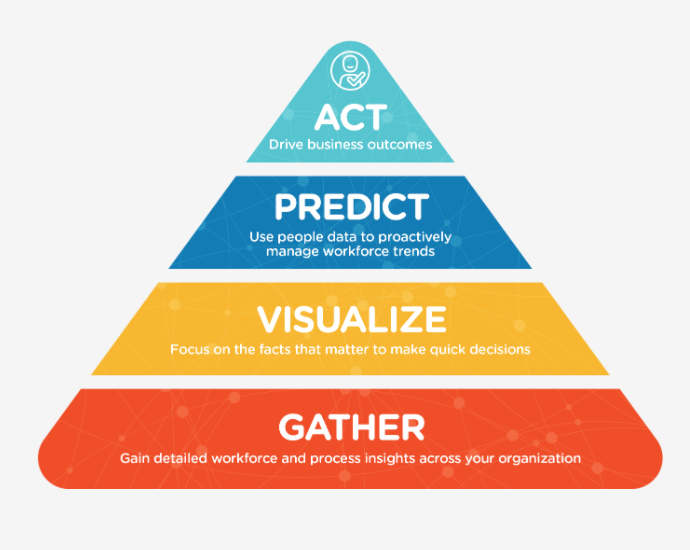
 Since we’ve created the foundation of “people analytics” by gathering data, we’ll process the next step—visualizing the data. Thinking visually is a big part of what makes people analytics a powerful resource. In fact, according to Aberdeen, organizations that have real-time visualizations are able to get critical data with their decision window 78% of the time, which is 2% more than organizations that don’t. Ideally, the HR technology you use should make it easy to add charts over your reports or create dashboards showing several charts with key metrics. For more information on this subject, check out our Blog.
Workforce Tip of the Week, sponsored by Spectrum Employee Services: ‘People analytics’ and visualizing data

Sign up for the free Daily Report email – local news about the people, companies and issues that impact business impact business in Baton Rouge and beyond.
